
Inflation Expectations Are Rising Again
Andres Viisemann, Head of LHV Pension Funds
July’s financial news was once again dominated by discussions around the tariffs imposed by the United States. Other key topics included the weak US dollar, President Donald Trump’s attempts to influence US monetary policy, and growing pressure on the Federal Reserve to significantly cut interest rates.
Trade Agreements Do Not Eliminate Uncertainty Entirely
In his so-called “liberation day” speech on April 2, President Trump shocked the world with his plan to impose high tariffs on goods imported into the US. He announced his intention to introduce a minimum 10% tariff on goods from nearly 60 of the US’s foreign trade partners. The specific tariff for each country, however, would depend on the size of the US’s trade deficit with that country. These new tariffs were originally scheduled to take effect on April 9, but the US postponed the deadline to give its trade partners time to negotiate.
On May 8, the US and the United Kingdom signed a so-called Economic Prosperity Agreement, setting the tariff rate for British goods at a minimum of 10%. On July 23, Japan agreed to a 15% tariff, and on July 27, the US and the European Union reached an agreement to apply a 15% tariff on goods produced in Europe.
It may appear that peace and stability have been achieved with the main trading partners, creating a favorable environment for international trade to develop. However, trade experts point out that these agreements were not drafted jointly, and there are significant disagreements between the parties regarding the specific terms. For President Trump, appearances were more important than substance.
Additionally, with President Trump, there is a real risk that he may withdraw from previous agreements at any moment to pursue a new objective. There is no force that could compel the president of the world’s most powerful economic and military nation to keep his promises or honor his words.
Large Budget Deficits Fuel Inflation
Another major issue in the global economy is the persistence of faster-than-desired consumer price growth. While price growth has slowed considerably in both Europe and the US, bond markets reflect investors’ doubts about whether the problem has truly been resolved.
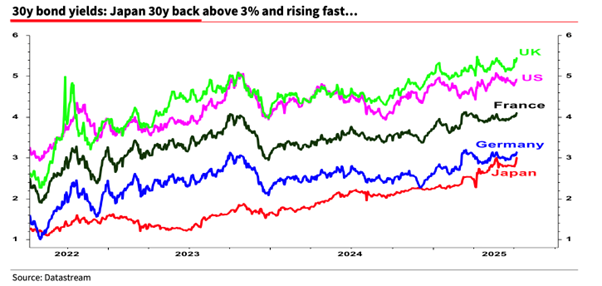
Figure 1. Yields on 30-year government bonds from Japan, Germany, France, the US, and the UK. Source: Société Générale.
Although central banks have lowered overnight interest rates, long-term bond yields have been on a steady upward trend again after a sharp drop at the end of 2023.
Almost everywhere in the world, the persistent price growth above desired levels is primarily explained by governments' inability to bring their revenues and expenditures under long-term control — ensuring that national debt does not grow faster than the economy as a whole.
The US Congressional Budget Office (CBO) forecasts a 2025 deficit of $1.9 trillion, which would constitute 6.2% of the US gross domestic product (GDP). During the year, the US government will need to refinance about $9.2 trillion worth of previously issued debt. Additionally, it must find new investors willing to invest $1.9 trillion in US government bonds — and even more in subsequent years.
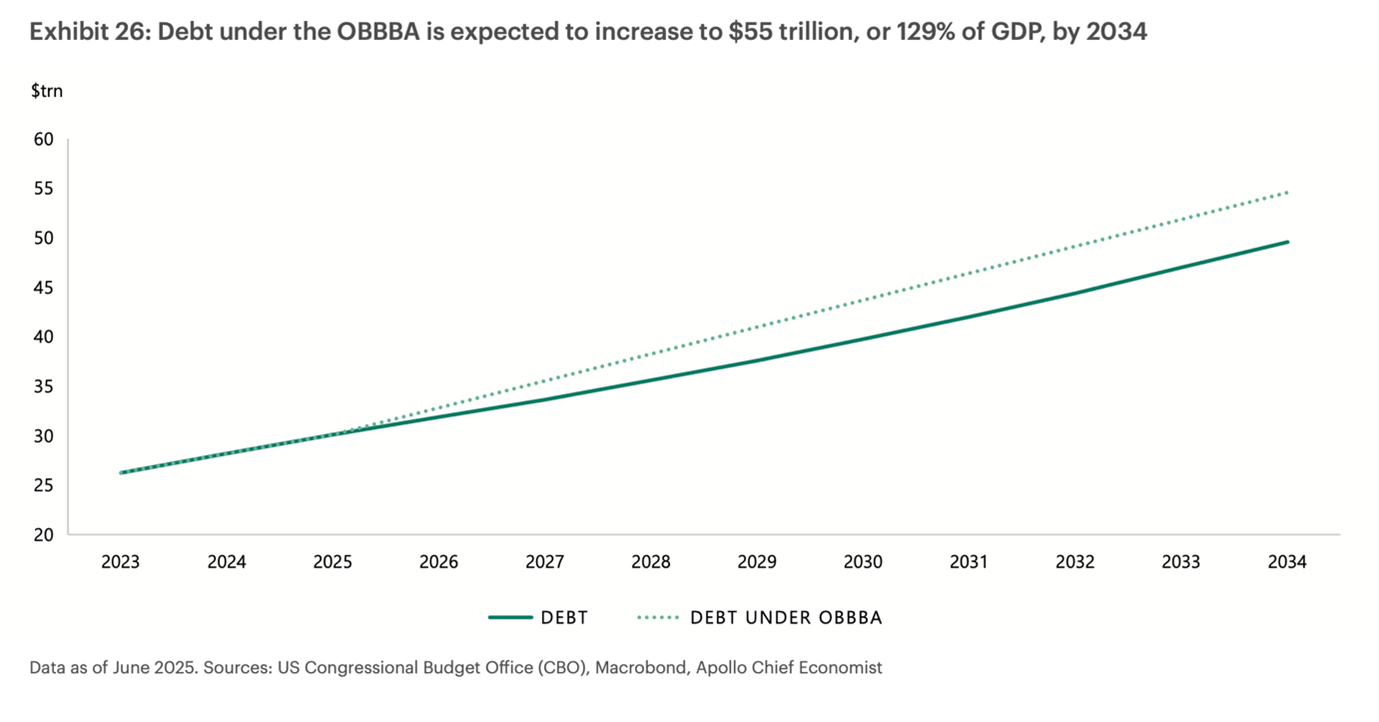
Figure 2. Projected change in the US national debt as a share of GDP after the approval of Donald Trump’s so-called One Big Beautiful Budget Act. Source: US Congressional Budget Office.
Currently, US national debt is about 100% of the country’s GDP. If this trend continues, the ratio will reach 129% by 2034.
Although voters expected President Trump to fix the country's finances, his “One Big Beautiful Budget Act” (OBBBA) is likely to make the situation worse. It must be acknowledged that, aside from Argentina, there are likely very few governments in the world willing to sacrifice political capital for a balanced budget—regardless of whether they lean left or right.
The United States is the world’s largest economy, but also its largest debtor. Because capital returns have been better there than elsewhere, and the US dollar is the primary reserve currency, capital has flowed into the US.
On the other hand, the large and growing debt burden shows that Americans are consuming more than they earn and continue to live beyond their means—as long as foreigners are willing to fund it. But this carries the risk that as the debt burden increases, so do risks—and with them, interest rates. This raises the question: who in the world is able and willing to finance Americans’ growing debt, and what happens when foreign investors want their money back?
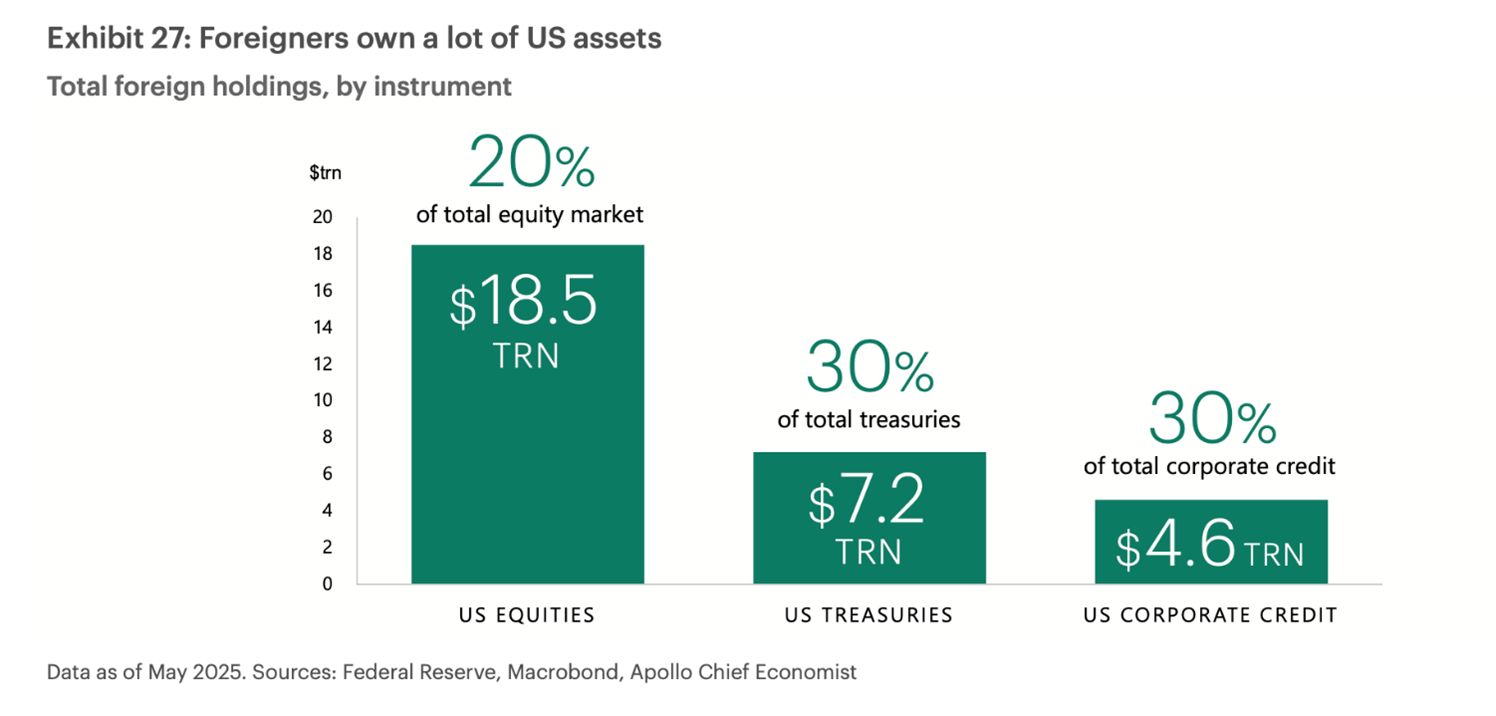
Figure 3. Share of foreign investment in US assets. Source: Apollo Global Management.
Throughout 2025, economists’ expectations for the US economic environment have steadily worsened. This has not changed despite the fact that the positive effects of President Trump’s budget law should be felt immediately, while the negative consequences are expected to emerge in the future.
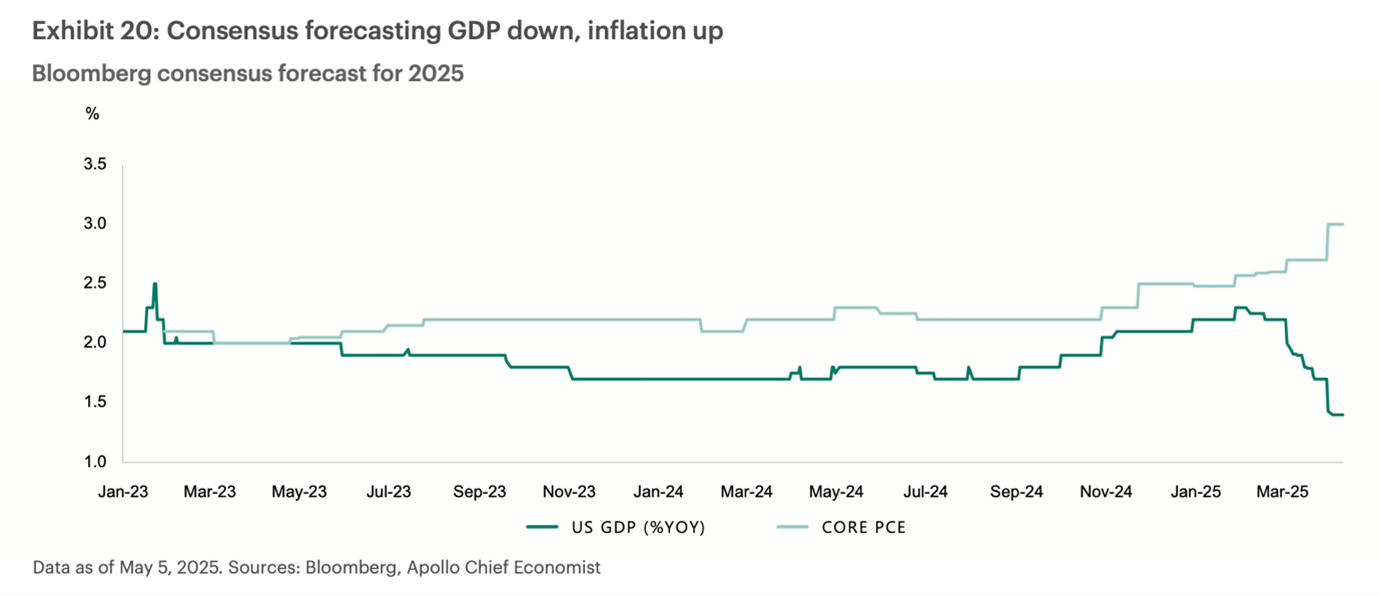
Figure 4. Consensus forecast from Bloomberg analysts for US 2025 GDP (dark green) and core inflation (light green). Source: Apollo.
As the world’s most powerful and innovative economy, the United States naturally attracts significant attention—what happens across the ocean affects the development of the global economy. As a result, the prices of US assets are much higher than elsewhere. High prices, of course, mean higher risks, and capital flows may one day reverse direction.
Despite the weakening of the US dollar this year, LHV pension funds remain cautious regarding dollar risk and are instead seeking investment opportunities in Europe.
July’s financial news was once again dominated by discussions around the tariffs imposed by the United States. Other key topics included the weak US dollar, President Donald Trump’s attempts to influence US monetary policy, and growing pressure on the Federal Reserve to significantly cut interest rates.